Lithium battery charging and discharging curve, SOC curve analysis Lithium battery charging and discharging curve, SOC curve analysis
The charge and discharge curve of lithium battery reflects a lot of information of the battery itself, through the discharge curve can understand a lot of performance of the battery.
The capacity information and discharge platform of the battery can be known by the discharge curve of the battery.
We mainly analyze the situation of power battery to do analysis, power lithium battery mainly for ternary lithium battery and lithium iron phosphate battery.
Ternary lithium battery voltage range is 2.8V~4.2V, typical value is about 3.6V, ternary lithium battery voltage platform is relatively steep;
The voltage range of lithium iron phosphate battery is 2.5V~3.65V, the typical value is about 3.2V, the voltage platform of lithium iron phosphate battery is relatively flat.
(Shenzhen Aiyang Power Co., LTD/www.iypower.com)
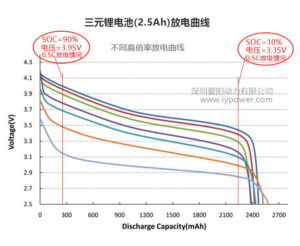
1. The discharge curve of ternary lithium battery (cell) is as follows:
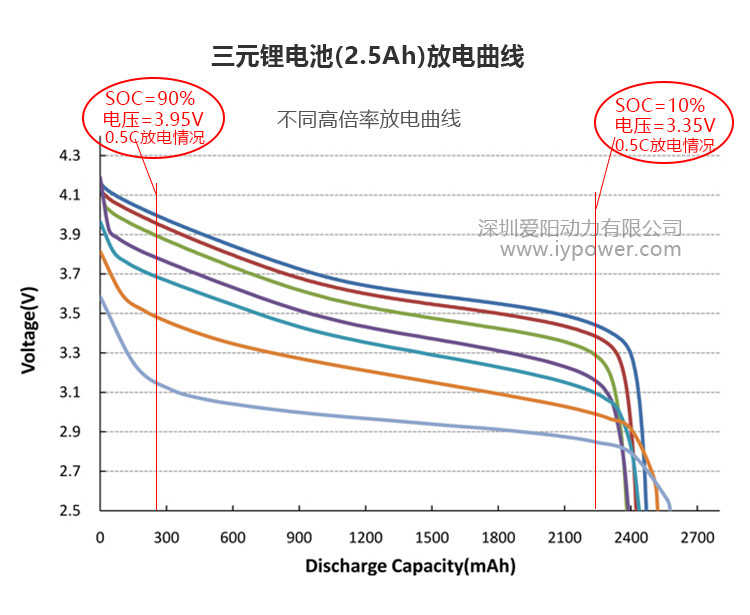
Pictured above is a 2,500mah power cell with an 18650 cell.
The charge and discharge curve is actually the relationship curve between the voltage and discharge capacity of the battery, that is, the curve of the remaining capacity SOC. The figure above can well reflect the following information:
The capacity of ternary lithium battery is mainly concentrated in 3.35V~3.95V, and 80% of the capacity is concentrated in this voltage range.
In addition, there are several discharge curves in the figure above, mainly the discharge curves corresponding to different discharge rates, discharge rate is large, discharge curve is low, discharge rate is small, discharge curve is hight.
The discharge curve of lithium iron phosphate battery (cell) is as follows:
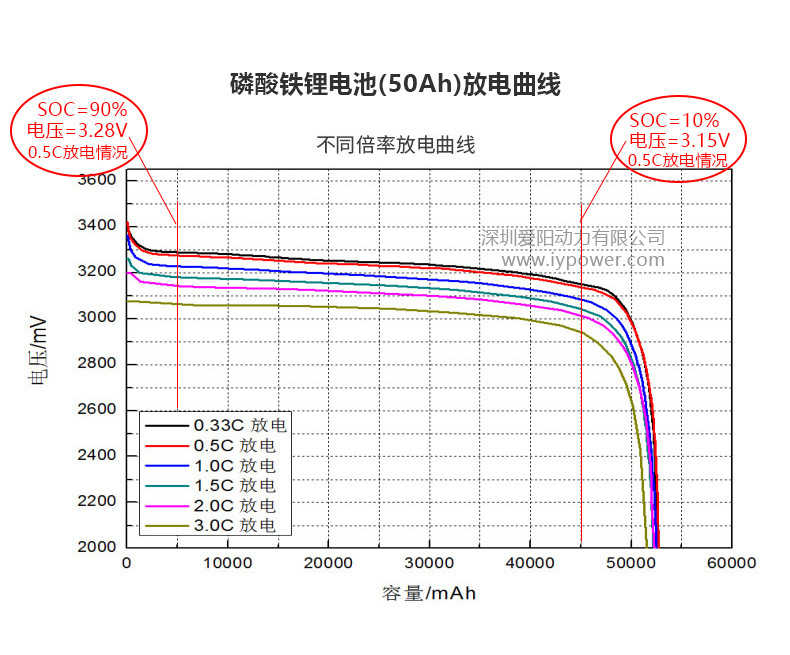
Above is a square lithium iron phosphate cell with a 50Ah power cell capacity.
The charge and discharge curve is actually the relationship between the voltage and discharge capacity of the battery. The figure above can reflect the following information:
The capacity of lithium phosphate battery is mainly concentrated in 3.15V~3.30V, and 80% of the capacity is concentrated in this voltage range.
In addition, there are several discharge curves in the figure above, mainly the discharge curves corresponding to different discharge rates, discharge rate is large, discharge curve is low, discharge rate is small, discharge curve is high.
In addition to the discharge rate, the discharge curve of lithium battery has a great relationship with temperature, and different temperature discharge curves have certain differences.